24 March (Part 2) - Statistics and lies
 When
any Bexley cabinet member stands up at a meeting and makes a statement including
numbers it is wise to take a closer look to make sure the wool is not being
pulled over residents’ eyes.
During Teresa O’Neill’s announcement that
council tax was to be frozen
in Bexley for a third consecutive year she left me with the impression that Bexley was the second most hard done by
council in London. I mentioned that to a friend from Bromley who immediately said
it could not be true because Bromley was second worst off. Some enquiries were called for.
O’Neill said the total tax take from the borough was second lowest in London, one above Waltham Forest,
which when you think about it is a bit of a nonsense. Being at the bottom of that league table
might mean the borough’s housing stock is not worth much by London standards or it may mean the
borough is not densely populated. It’s not a good basis for comparisons, something
per-capita based would be more honest. The leader
provided one of those figures too which put Bexley fourth from the bottom.
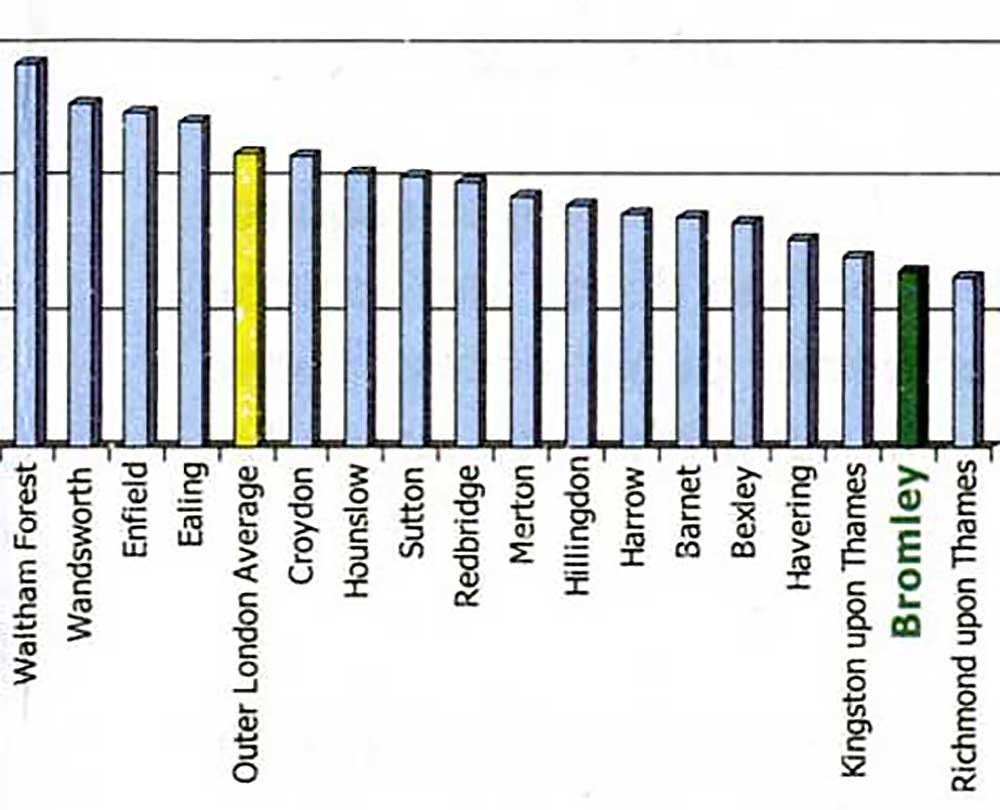
Bromley has found a different way of expressing the figures which gets them
into second to bottom place with Bexley 5th worst off. Click their associated
histogram for the whole story.
Who’s right? 5th, 4th or 2nd from the bottom? Probably all of them. It’s typical of politicians
to play with the numbers to gain some perceived advantage.
One fact remains however. Bromley has raised its tax rate in an attempt to avoid the sort of
black hole which Bexley is heading for but
its rate is still likely to remain
second lowest in Outer London.
Government figures - if you have the time to wade through them,
confuse the issue even more. Bromley drops to bottom place.
Note: I have not received my tax demand yet. Leaving it late aren’t they?

